 Web Server Statistics for vividpicture.com Web Server Statistics for vividpicture.com
(Go To: Top: General Summary: Daily Summary: Hourly Summary: Domain Report: Organization Report: Operating System Report: Status Code Report: File Size Report: File Type Report: Directory Report: Request Report)
This report contains overall statistics.
Successful requests: 9,759
Average successful requests per day: 9,751
Successful requests for pages: 7,254
Average successful requests for pages per day: 7,247
Failed requests: 2,472
Redirected requests: 770
Distinct files requested: 1,901
Distinct hosts served: 977
Corrupt logfile lines: 27
Data transferred: 1.13 gigabytes
Average data transferred per day: 1.13 gigabytes
(Go To: Top: General Summary: Daily Summary: Hourly Summary: Domain Report: Organization Report: Operating System Report: Status Code Report: File Size Report: File Type Report: Directory Report: Request Report)
This report lists the total activity for each day of the week, summed over all the weeks in the report.
Each unit ( ) represents 200 requests
for pages or part thereof.
) represents 200 requests
for pages or part thereof.
day: #reqs: #pages: ---: -----: ------: Sun: 9757: 7253:
(Go To: Top: General Summary: Daily Summary: Hourly Summary: Domain Report: Organization Report: Operating System Report: Status Code Report: File Size Report: File Type Report: Directory Report: Request Report)
This report lists the total activity for each hour of the day, summed over all the days in the report.
Each unit () represents 15 requests
for pages or part thereof.
hour: #reqs: #pages: ----: -----: ------: 0: 305: 224:3: 623: 301:
6: 610: 474:
7: 362: 286:
22: 255: 170:
(Go To: Top: General Summary: Daily Summary: Hourly Summary: Domain Report: Organization Report: Operating System Report: Status Code Report: File Size Report: File Type Report: Directory Report: Request Report)
This report lists the countries of the computers which requested files.
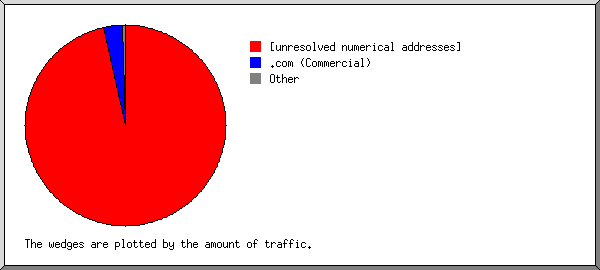
Listing domains, sorted by the amount of traffic.
#reqs: %bytes: domain
-----: ------: ------
 7071: 86.12%: [unresolved numerical addresses]
 2346: 13.30%: .com (Commercial)
  117:  0.33%: .net (Networks)
   83:  0.12%: .ru (Russia)
    3:  0.06%: .ec (Ecuador)
   38:  0.02%: [unknown domain]
   58:  0.02%: .de (Germany)
    6:  0.01%: .id (Indonesia)
    3:  0.01%: .cz (Czech Republic)
    3:       : .us (United States)
    2:       : .vn (Vietnam)
    2:       : .fm (Micronesia)
    1:       : .jp (Japan)
    1:       : .ke (Kenya)
    1:       : .in (India)
    1:       : .ch (Switzerland)
    7:       : .org (Non Profit Making Organizations)
    1:       : .br (Brazil)
    3:       : .pl (Poland)
    2:       : .info (Informational)
    2:       : .uk (United Kingdom)
    2:       : .it (Italy)
    1:       : .dk (Denmark)
    5:       : .es (Spain)
(Go To: Top: General Summary: Daily Summary: Hourly Summary: Domain Report: Organization Report: Operating System Report: Status Code Report: File Size Report: File Type Report: Directory Report: Request Report)
This report lists the organizations of the computers which requested files.
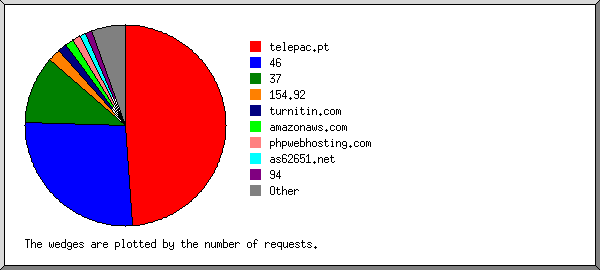
Listing the top 20 organizations by the number of requests, sorted by the number of requests.
#reqs: %bytes: organization
-----: ------: ------------
 1531: 54.46%: 62.140
 1050:  1.55%: 45
 1023:  0.87%: 185.110
 1020:  0.87%: 185.210
  800:       : 91
  783:  8.16%: amazonaws.com
  504: 20.47%: 193.233
  406:       : phpwebhosting.com
  355:  0.70%: petalsearch.com
  251:       : turnitin.com
  192:  0.08%: googleusercontent.com
  191:  0.08%: 52
  182:  0.59%: 5
  161:  0.17%: 216.244
   96:  0.02%: 17
   67:  0.06%: 185.108
   55:  0.02%: hwclouds-dns.com
   53:  0.08%: hosted-by-vdsina.ru
   45:  0.01%: contaboserver.net
   42:  1.22%: semrush.com
  952: 10.60%: [not listed: 195 organizations]
(Go To: Top: General Summary: Daily Summary: Hourly Summary: Domain Report: Organization Report: Operating System Report: Status Code Report: File Size Report: File Type Report: Directory Report: Request Report)
This report lists the operating systems used by visitors.
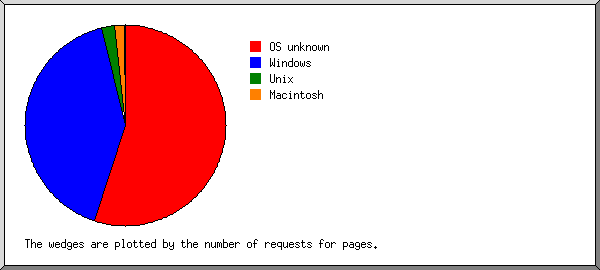
Listing operating systems, sorted by the number of requests for pages.
 #: #reqs: #pages: OS
--: -----: ------: --
 1:  6220:   5250: Windows
  :  5803:   4971:   Windows NT
  :   405:    271:   Unknown Windows
  :    11:      7:   Windows XP
  :     1:      1:   Windows 2000
 2:  2571:   1402: OS unknown
 3:   458:    271: Unix
  :   456:    270:   Linux
  :     2:      1:   BSD
 4:   216:    150: Macintosh
 5:   101:     29: Known robots
(Go To: Top: General Summary: Daily Summary: Hourly Summary: Domain Report: Organization Report: Operating System Report: Status Code Report: File Size Report: File Type Report: Directory Report: Request Report)
This report lists the HTTP status codes of all requests.
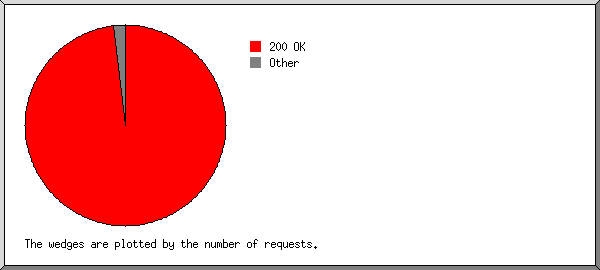
Listing status codes, sorted numerically.
#reqs: status code
-----: -----------
 9608: 200 OK
   24: 206 Partial content
  697: 301 Document moved permanently
   73: 302 Document found elsewhere
  127: 304 Not modified since last retrieval
    1: 400 Bad request
    5: 401 Authentication required
    5: 403 Access forbidden
 1620: 404 Document not found
   20: 405 Method not allowed
  821: 500 Internal server error
(Go To: Top: General Summary: Daily Summary: Hourly Summary: Domain Report: Organization Report: Operating System Report: Status Code Report: File Size Report: File Type Report: Directory Report: Request Report)
This report lists the sizes of files.
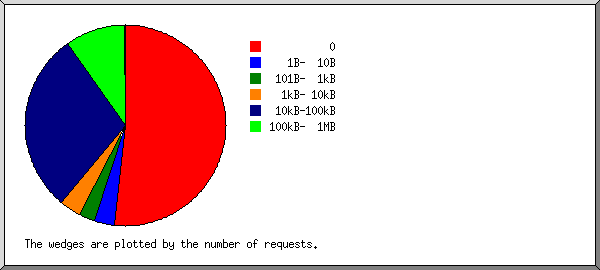
       size: #reqs: %bytes:
-----------: -----: ------:
          0:  1258:       :
   1B-  10B:   839:       :
  11B- 100B:    24:       :
 101B-  1kB:  1022:  0.05%:
  1kB- 10kB:  1129:  0.36%:
 10kB-100kB:  3628:  3.68%:
100kB-  1MB:  1859: 95.91%:
(Go To: Top: General Summary: Daily Summary: Hourly Summary: Domain Report: Organization Report: Operating System Report: Status Code Report: File Size Report: File Type Report: Directory Report: Request Report)
This report lists the extensions of files.
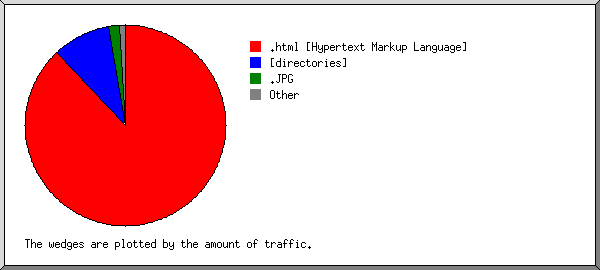
Listing extensions with at least 0.1% of the traffic, sorted by the amount of traffic.
#reqs: %bytes: extension
-----: ------: ---------
 1984: 90.98%: .html [Hypertext Markup Language]
   77:  4.53%: .current
 5270:  3.31%: [directories]
   97:  0.28%: .js   [JavaScript code]
 1732:  0.26%: .php  [PHP]
   50:  0.17%: .jpg  [JPEG graphics]
   23:  0.15%: .png  [PNG graphics]
  526:  0.33%: [not listed: 18 extensions]
(Go To: Top: General Summary: Daily Summary: Hourly Summary: Domain Report: Organization Report: Operating System Report: Status Code Report: File Size Report: File Type Report: Directory Report: Request Report)
This report lists the directories from which files were requested. (The figures for each directory include all of its subdirectories.)
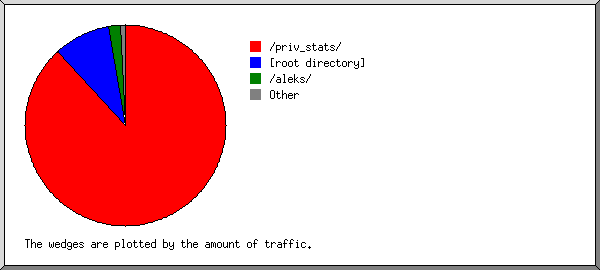
Listing directories with at least 0.01% of the traffic, sorted by the amount of traffic.
#reqs: %bytes: directory
-----: ------: ---------
 4988: 98.10%: /priv_stats/
  939:  0.48%: /wp-content/
 2500:  0.45%: [root directory]
  608:  0.35%: /aleks/
  434:  0.22%: /wp-includes/
   87:  0.14%: /2015/
   87:  0.12%: /sample-page/
   37:  0.08%: /author/
   33:  0.01%: /wp-admin/
    2:  0.01%: /LW_Test_Site/
   13:  0.01%: /wp-login.php/
   31:  0.03%: [not listed: 11 directories]
(Go To: Top: General Summary: Daily Summary: Hourly Summary: Domain Report: Organization Report: Operating System Report: Status Code Report: File Size Report: File Type Report: Directory Report: Request Report)
This report lists the files on the site.
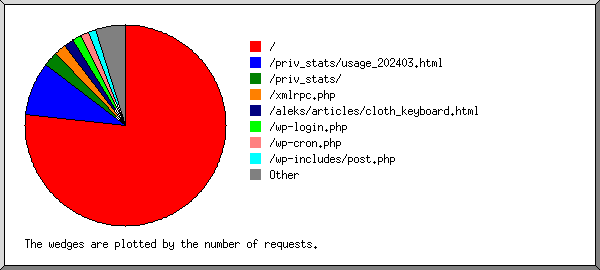
Listing files with at least 20 requests, sorted by the number of requests.
#reqs: %bytes:          last time: file
-----: ------: ------------------: ----
 3136:  2.67%: May/11/25 11:59 PM: /priv_stats/
 1078:  0.12%: May/11/25 11:56 PM: /
  585: 27.54%: May/12/25 12:01 AM: /priv_stats/usage_202007.html
  578: 27.16%: May/11/25 11:56 PM: /priv_stats/usage_201506.html
  487:  0.20%: May/11/25 11:56 PM: /wp-login.php
  408:       : May/11/25 11:55 PM: /wp-cron.php
  389:  0.01%: May/11/25 11:45 PM: /xmlrpc.php
  289:  0.05%: May/11/25 11:59 PM: /aleks/fat/rss.xml
  203:  0.08%: May/11/25 11:56 PM: /aleks/articles/cloth_keyboard.html
   88:       : May/11/25 11:55 PM: /robots.txt
   85:  0.12%: May/11/25 10:21 PM: /sample-page/
   77:  4.53%: May/11/25 11:09 PM: /priv_stats/webalizer.current
   72:  4.30%: May/11/25 11:36 PM: /priv_stats/usage_202410.html
   68:  4.11%: May/11/25 11:53 PM: /priv_stats/usage_202409.html
   68:  4.12%: May/11/25 11:33 PM: /priv_stats/usage_202411.html
   66:  4.06%: May/11/25 11:26 PM: /priv_stats/usage_202412.html
   66:  3.98%: May/11/25 11:24 PM: /priv_stats/usage_202408.html
   58:  3.42%: May/11/25 11:50 PM: /priv_stats/usage_202505.html
   40:  0.09%: May/11/25 10:22 PM: /2015/07/27/apple-watch-vs-ipod-nano/
   36:  0.08%: May/11/25 11:53 PM: /author/aleks/
 1882: 13.33%: May/12/25 12:00 AM: [not listed: 1,238 files]
(Go To: Top: General Summary: Daily Summary: Hourly Summary: Domain Report: Organization Report: Operating System Report: Status Code Report: File Size Report: File Type Report: Directory Report: Request Report)

